
84 million denied claims. 263,000 appeals.
That's the gap.
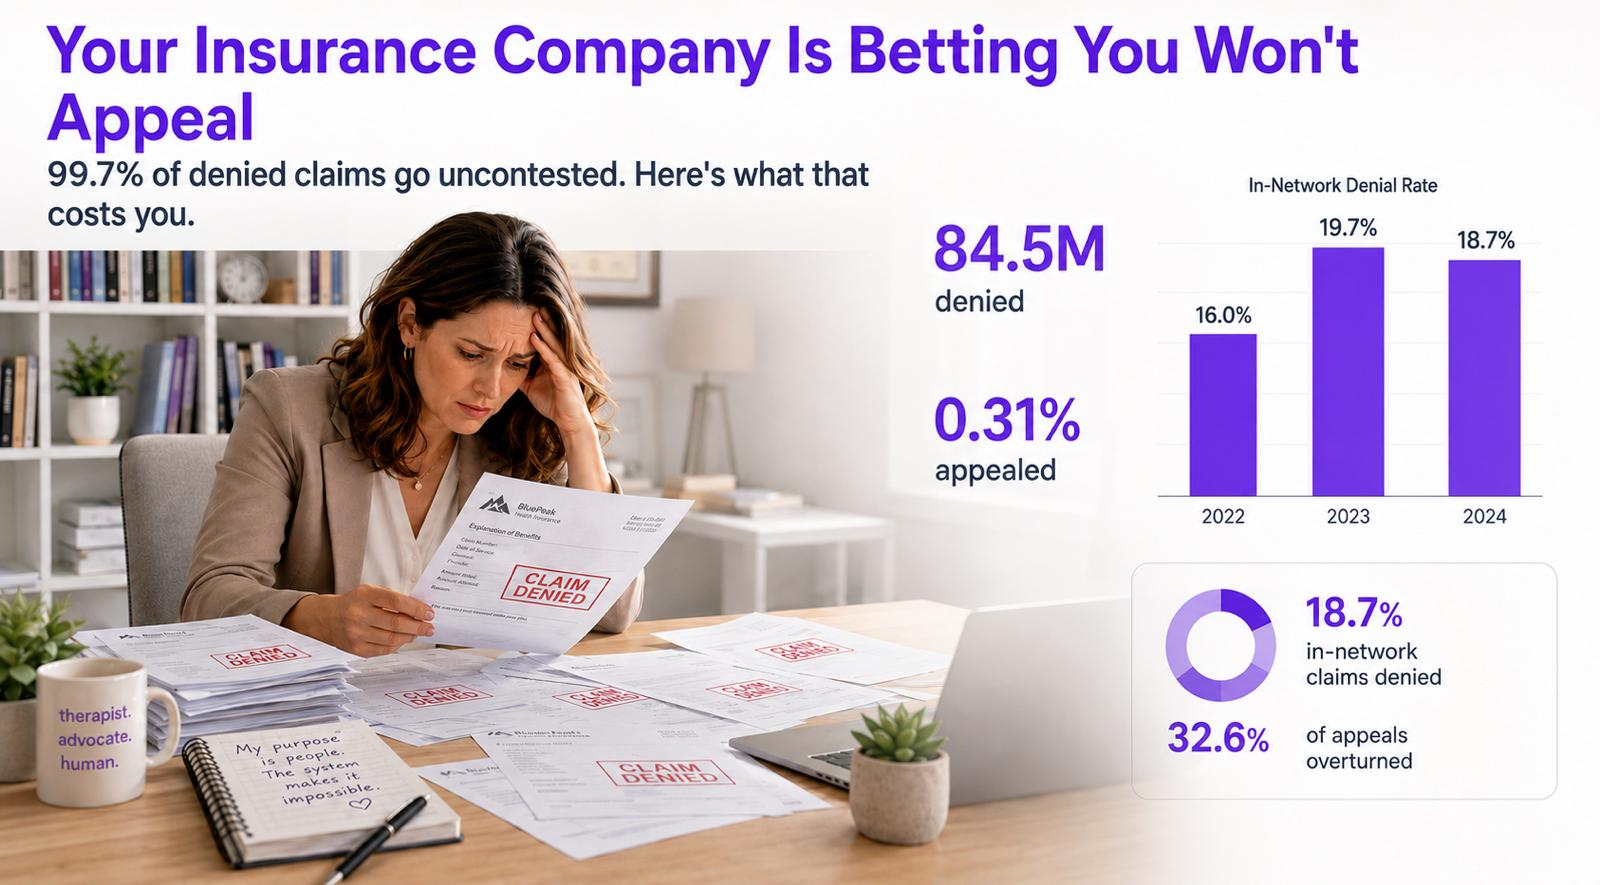
In 2024, insurance companies on the ACA marketplace denied 84.5 million in-network claims — an 18.7% denial rate. Of those 84.5 million denials, providers appealed just 263,021. That's an appeal rate of 0.31%.
And here's the part that should make you angry: 32.6% of those appeals were overturned.
One in three. The insurer denied the claim, the provider pushed back, and the insurer said fine, we'll pay it. Which means the insurer knew — or should have known — that tens of millions of those denials were wrong. They just bet you wouldn't fight.
I downloaded three years of CMS Transparency in Coverage data — 1.25 billion claims across 2022, 2023, and 2024 — and analyzed what's actually happening to providers who accept insurance. The trend is worse than the headline numbers suggest.
Three years of escalation
This isn't a one-year anomaly. It's a pattern.
| 2022 | 2023 | 2024 | |
|---|---|---|---|
| In-network claims | 358.9M | 436.0M | 451.2M |
| In-network denied | 57.6M | 85.9M | 84.5M |
| In-network denial rate | 16.0% | 19.7% | 18.7% |
| Appeals filed | 110,084 | 376,508 | 263,021 |
| Appeals overturned | 47,322 | 164,960 | 85,807 |
| Overturn rate | 43.0% | 43.8% | 32.6% |
| Appeal rate (% of denials) | 0.19% | 0.44% | 0.31% |
In 2022, insurers denied 16% of in-network claims. By 2023, that number spiked to 19.7% — a 23% increase in a single year. In 2024, the denial rate pulled back slightly to 18.7%, but that's still 17% higher than 2022. The spike wasn't a correction. It was a new baseline.
What happened to the overturn rate tells a darker story. In 2022 and 2023, providers who appealed won roughly 43% of the time — nearly half. In 2024, that dropped to 32.6%. Did insurers suddenly start making more accurate denial decisions? Or did they invest in defending their denials at the appeals stage?
The denial rate barely moved. The overturn rate dropped 11 points. That's not improved accuracy — that's improved defense.
The reasons insurers give
When an insurer denies a claim, they're required to report a reason. Here's what they actually report — using the most recent 2024 data:
| Denial reason | Share of all denials |
|---|---|
| "Other" (unspecified) | 32.3% |
| Administrative | 22.5% |
| Excluded service | 11.6% |
| Out of network | 9.8% |
| Referral required | 8.4% |
| Member not covered | 6.6% |
| Not medically necessary (non-BH) | 4.1% |
| Benefit limit reached | 4.2% |
| Not medically necessary (behavioral health) | 0.4% |
| Investigational/experimental | 0.1% |
A third of all denials have no specific reason. "Other" is the single largest category at 32.3% — representing 28.1 million denied claims in 2024 alone with no clinical or administrative explanation. Another 22.5% are "Administrative" — paperwork issues, not clinical judgments.
Over half of all denials fall into categories that are either unexplained, procedural, or fixable. These aren't insurers exercising clinical expertise. They're friction points designed to reduce payouts.
Behavioral health is targeted
Behavioral health medical necessity denials — claims where the insurer says your therapy session wasn't "medically necessary" — have been volatile across all three years:
| 2022 | 2023 | 2024 | |
|---|---|---|---|
| BH med-necessity denials | 274,774 | 469,955 | 374,394 |
| Non-BH med-necessity denials | 2,544,991 | 3,898,817 | 3,594,527 |
| BH share of med-necessity | 9.7% | 10.8% | 9.4% |
In 2023, behavioral health medical necessity denials surged 71% in a single year — from 274,774 to 469,955. That pulled back to 374,394 in 2024, but that's still 36% higher than 2022. The spike year set a new floor.
Independent research confirms this pattern goes even deeper. A JAMA Internal Medicine study analyzing 51,394 external appeals in New York found that denied behavioral health claims — specifically substance abuse and mental health services — were overturned 60-61% of the time when reviewed by independent clinical experts not affiliated with the insurer. That's higher than the overall overturn rate of 46.7%.
When independent doctors look at behavioral health denials, they reverse them more often than not. The insurers aren't making clinical decisions. They're making financial ones.
The math per therapist
Let's make this concrete.
This scenario models a therapist providing 25 insurance-billed sessions per week for 48 weeks per year — 1,200 sessions annually. The 2026 Medicare reimbursement rate for a 45-minute psychotherapy session (CPT 90834) is $113.89. For a 60-minute session (CPT 90837), it's $167.00. The calculation uses a blended reimbursement assumption of $140.44 per session.*
| Using 2024 data | Using 2023 data | |
|---|---|---|
| Total sessions/year | 1,200 | 1,200 |
| Denial rate | 18.7% | 19.7% |
| Denied sessions | 224 | 236 |
| Revenue denied | $31,459 | $33,145 |
| Modeled current appeals | ~1 session | ~1 session |
| If all denials appealed | 224 | 236 |
| Overturn rate | 32.6% | 43.8% |
| Sessions recovered | 73 | 103 |
| Estimated annual gross recovery opportunity | $10,252* | $14,466* |
Under the modeled practice assumptions, the 2024 inputs produce an estimated annual gross recovery opportunity of $10,252*. Applying the 2023 inputs produces $14,466.*
Applying each year's reported appeal rate to this scenario produces approximately one appeal per year. This is a modeled result, not a measured average for therapists.
* Read the estimate assumptions.
Why therapists don't appeal
Only 0.31% of denied claims are appealed. Applied to the modeled practice above, that's roughly 1 appeal per year out of 224 denials.*
It's not because therapists don't care about the money. It's because the appeal process is designed to exhaust you:
- Each appeal requires pulling the original claim, writing a clinical justification, gathering supporting documentation, and resubmitting through a process that varies by payer
- The average appeal takes 45-60 minutes of admin time per claim
- Most therapists are already spending 14+ hours per week on documentation and insurance paperwork
- Many therapists don't even know a denial happened until they reconcile their billing weeks later
- The process is intentionally payer-specific — different forms, different deadlines, different submission methods for every insurer
The system works exactly as designed. Deny first. Count on providers being too burned out, too busy, or too confused to push back. Collect the savings.
84 million claims left on the table
Scale this up. Across the ACA marketplace alone — not counting employer-sponsored plans, Medicare Advantage, or Medicaid — 84.2 million denied claims went uncontested in 2024.
For Medicare Advantage, the economics are even more extreme. KFF's analysis of CMS data shows that MA insurers made 52.8 million prior authorization determinations in 2024. Of the 4.1 million that were denied, only 11.5% were appealed — and 80.7% of those appeals were overturned.
Read that again: insurers denied 4.1 million prior authorization requests. When providers appealed, 4 out of 5 denials were reversed. The insurer's own internal review agreed the denial was wrong 80% of the time.
The three-year trend across both ACA marketplace and Medicare Advantage tells the same story: insurers deny at scale, providers don't fight back, and the ones who do fight back win a significant portion of the time. This isn't a broken process. It's working exactly as intended — for the insurers.
What this means for your practice
If you're a therapist in private practice accepting insurance, denials are not a billing error — they're a business model. And the only defense is a system that catches them, flags them, and makes appealing as easy as clicking a button.
Here's what the data says you should do:
- Know your denial rate. The national average is 18.7%. What's yours? If you don't track it, you can't fix it.
- Appeal everything that's clinically justified. Even at the conservative 2024 overturn rate of 32.6%, you'll recover roughly one in three denied claims. At $140/session, that math works.
- Look at the denial reason. Over half of denials are "Other," "Administrative," or "Referral required" — categories where the fix is resubmission or correction, not clinical justification.
- Automate the tracking. You cannot manually reconcile ERA remittance data across 25 clients, multiple payers, and 1,200 annual sessions. You need software that does it for you.
This is exactly why I built Therapy Companion's insurance intelligence features. The platform tracks every claim from submission through payment, flags denials automatically, identifies patterns by payer and denial reason, and surfaces the claims worth appealing — with the clinical documentation already attached.
The goal isn't to make you a billing expert. It's to make sure you get paid for the work you already did.
Methodology
Claims denial data: CMS Transparency in Coverage Public Use Files, Plan Years 2024, 2025, and 2026 (containing 2022, 2023, and 2024 service year data respectively). Downloaded from data.healthcare.gov. PY2024: 174 issuers, 6,760 individual QHP plans, 358.9M in-network claims. PY2025: 175 issuers, 6,764 plans, 436.0M in-network claims. PY2026: 186 issuers, 6,764 plans, 451.2M in-network claims. Analysis limited to individual marketplace medical QHPs on HealthCare.gov (FFE and SBE-FP exchanges); does not include state-based exchanges, employer-sponsored plans, or government programs.
Reimbursement rates: CMS Medicare Physician Fee Schedule, 2026 national rates. CPT 90834 ($113.89), CPT 90837 ($167.00). Blended average ($140.44) used for per-therapist revenue estimates. Private insurance reimbursement rates vary by payer, geography, and contract — actual denied revenue per therapist may be higher or lower.
Medicare Advantage data: KFF analysis of CMS Part C prior authorization reporting data, 2019-2024. 52.8 million prior authorization determinations in 2024 across all MA contracts.
External review data: Bruch et al., JAMA Internal Medicine (2025/2026). Analysis of 51,394 closed external review cases in New York State, May 2019 – December 2025. Behavioral health overturn rates (60-61%) are specific to New York IRO data and may not generalize to all states.
Estimate assumptions
* Estimate models a therapist providing 25 insurance-billed sessions per week for 48 weeks annually, with assumed reimbursement of $140.44 (approximately $140) per session. It applies the 18.7% denial rate and 32.6% appeal overturn rate calculated in our analysis of 2024 CMS marketplace data. The calculation assumes all modeled denials are appealed and each favorable outcome produces the full assumed reimbursement, before appeal costs. These rates cover multiple medical specialties; applying them to previously unappealed therapy claims is a modeling assumption. Actual therapy-practice results may differ, and CMS includes both full and partial reversals in overturned appeals.
The displayed $10,252 uses 73 rounded favorable outcomes × $140.44. The 2023 comparison applies a 19.7% denial rate and 43.8% overturn rate to the same practice assumptions.
This analysis is part of our ongoing series using public health data to understand the challenges therapists face. Have a dataset you'd like us to analyze?